File: /var/www/ivs.kaunokolegija.lt/laravel/vendor/laraveldaily/laravel-charts/readme.md
## Laravel Charts
Package to generate Chart.js charts directly from Laravel/Blade, without interacting with JavaScript.
---
## Simple Usage
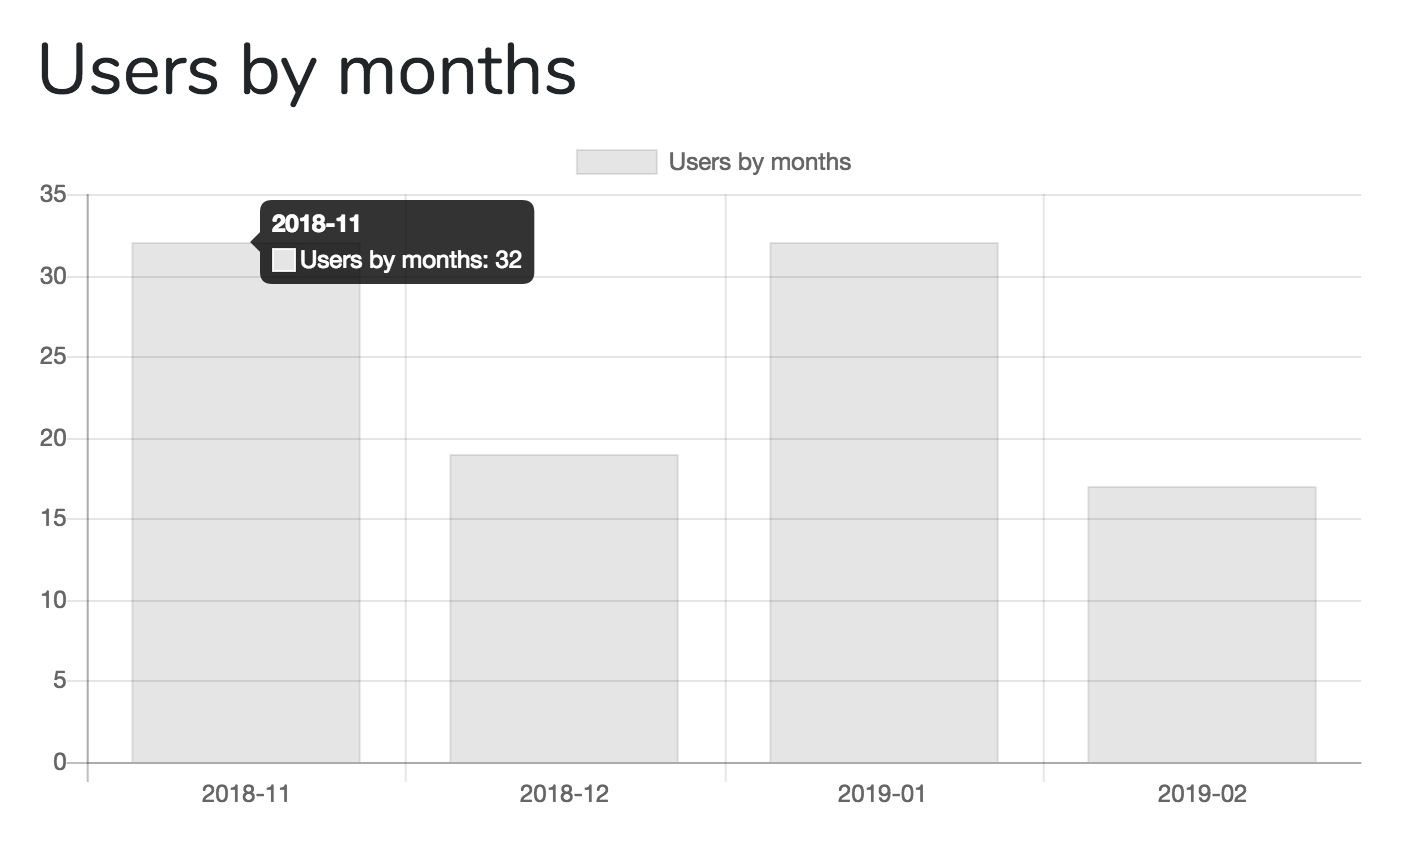
If you want to generate a chart above, grouping __users__ records by the month of __created_at__ value, here's the code.
__Controller__:
```php
use LaravelDaily\LaravelCharts\Classes\LaravelChart;
// ...
$chart_options = [
'chart_title' => 'Users by months',
'report_type' => 'group_by_date',
'model' => 'App\Models\User',
'group_by_field' => 'created_at',
'group_by_period' => 'month',
'chart_type' => 'bar',
];
$chart1 = new LaravelChart($chart_options);
return view('home', compact('chart1'));
```
__View File__
```blade
@extends('layouts.app')
@section('content')
<div class="container">
<div class="row justify-content-center">
<div class="col-md-8">
<div class="card">
<div class="card-header">Dashboard</div>
<div class="card-body">
<h1>{{ $chart1->options['chart_title'] }}</h1>
{!! $chart1->renderHtml() !!}
</div>
</div>
</div>
</div>
</div>
@endsection
@section('javascript')
{!! $chart1->renderChartJsLibrary() !!}
{!! $chart1->renderJs() !!}
@endsection
```
---
## Installation
```sh
composer require laraveldaily/laravel-charts
```
No additional configuration or other parameters yet.
---
## Usage
You need to create `LaravelChart` object in your Controller, passing array of options.
```php
$chart = new LaravelChart($options);
```
Then pass it to the View, as a variable:
```php
return view('dashboard', compact('chart'));
```
---
## Available Reports and Options
Currently package support three types of charts/reports:
- `group_by_date` - amount of records from the same table, grouped by time period - day/week/month/year;
- `group_by_string` - amount of records from the same table, grouped by any string field, like `name`;
- `group_by_relationship` - amount of records from the same table, grouped by `belongsTo` relationship's field
### NOTE: From Laravel 8, all its models are placed in a folder called Models (App\Models\)
__Example with all options__
```php
$chart_options = [
'chart_title' => 'Transactions by dates',
'chart_type' => 'line',
'report_type' => 'group_by_date',
'model' => 'App\Models\Transaction',
'conditions' => [
['name' => 'Food', 'condition' => 'category_id = 1', 'color' => 'black', 'fill' => true],
['name' => 'Transport', 'condition' => 'category_id = 2', 'color' => 'blue', 'fill' => true],
],
'group_by_field' => 'transaction_date',
'group_by_period' => 'day',
'aggregate_function' => 'sum',
'aggregate_field' => 'amount',
'aggregate_transform' => function($value) {
return round($value / 100, 2);
},
'filter_field' => 'transaction_date',
'filter_days' => 30, // show only transactions for last 30 days
'filter_period' => 'week', // show only transactions for this week
'continuous_time' => true, // show continuous timeline including dates without data
];
```
- `chart_title` (required) - just a text title that will be shown as legend;
- `chart_type` (required) - possible values: "line", "bar", "pie";
- `report_type` (required) - see above, can be `group_by_date`, `group_by_string` or `group_by_relationship`;
- `model` (required) - name of Eloquent model, where to take the data from;
- `name` (optional) - just a text title that will be shown as title, otherwise the legend is used;
- `conditions` (optional, only for `line` chart type) - array of conditions (name + raw condition + color) for multiple datasets;
- `group_by_field` (required) - name of database field that will be used in `group_by` clause;
- `group_by_period` (optional, only for `group_by_date` report type) - possible values are "day", "week", "month", "year";
- `relationship_name` (optional, only for `group_by_relationship` report type) - the name of model's method that contains `belongsTo` relationship.
- `aggregate_function` (optional) - you can view not only amount of records, but also their `SUM()` or `AVG()`. Possible values: "count" (default), "avg", "sum".
- `aggregate_field` (optional) - see `aggregate_function` above, the name of the field to use in `SUM()` or `AVG()` functions. Irrelevant for `COUNT()`.
- `aggregate_transform` (optional) - callback function for additional transformation of aggregate number
- `filter_field` (optional) - show only data filtered by that datetime field (see below)
- `filter_days` (optional) - see `filter_field` above - show only last `filter_days` days of that field. Example, last __30__ days by `created_at` field.
- `filter_period` (optional) - another way to filter by field, show only record from last __week__ / __month__ / __year__. Possible values are "week", "month", "year".
- `continuous_time` (optional) - show all dates on chart, including dates without data.
- `show_blank_data` (optional) - show date even if the data is blank based on `filter_days`.
- `range_date_start` (optional) - show data in from a date range by `filter_field`, this is the start date.
- `range_date_end` (optional) - show data in from a date range by `filter_field`, this is the end date.
- `field_distinct` (optional) - field name required, it will apply a distinct(fieldname)
- `style_class` (optional) - add class css in canvas
- `date_format` (optional) - add the date format, by default: American format Y-m-d
- `where_raw` (optional) - Condition in multiple consultation situations
- `chart_height` (optional) - add the height in options, default 300px
- `date_format_filter_days` (optional) - add the date format for Filter days
- `withoutGlobalScopes` (optional) - removes global scope restriction from queried model
- `with_trashed` (optional) - includes soft deleted models
- `only_trashed` (optional) - only displays soft deleted models
- `top_results` (optional, integer) - limit number of results shown, see [Issue #49](https://github.com/LaravelDaily/laravel-charts/issues/49)
- `chart_color` (optional, value in rgba, like "0,255,255") - defines the color of the chart
- - - - -
## Example with relationship
```php
$chart_options = [
'chart_title' => 'Transactions by user',
'chart_type' => 'line',
'report_type' => 'group_by_relationship',
'model' => 'App\Models\Transaction',
'relationship_name' => 'user', // represents function user() on Transaction model
'group_by_field' => 'name', // users.name
'aggregate_function' => 'sum',
'aggregate_field' => 'amount',
'filter_field' => 'transaction_date',
'filter_days' => 30, // show only transactions for last 30 days
'filter_period' => 'week', // show only transactions for this week
];
```
---
## Rendering Charts in Blade
After you passed `$chart` variable, into Blade, you can render it, by doing __three__ actions:
__Action 1. Render HTML__.
Wherever in your Blade, call this:
```blade
{!! $chart1->renderHtml() !!}
```
It will generate something like this:
```html
<canvas id="myChart"></canvas>
```
__Action 2. Render JavaScript Library__
Package is using Chart.js library, so we need to initialize it somewhere in scripts section:
```blade
{!! $chart1->renderChartJsLibrary() !!}
```
It will generate something like this:
```html
<script src="https://cdnjs.cloudflare.com/ajax/libs/Chart.js/2.5.0/Chart.min.js"></script>
```
__Action 3. Render JavaScript of Specific Chart__
After Chart.js is loaded, launch this:
```blade
{!! $chart1->renderJs() !!}
```
---
## Using Multiple Charts
You can show multiple charts on the same page, initialize them separately.
__Controller__:
```php
public function index()
{
$chart_options = [
'chart_title' => 'Users by months',
'report_type' => 'group_by_date',
'model' => 'App\Models\User',
'group_by_field' => 'created_at',
'group_by_period' => 'month',
'chart_type' => 'bar',
'filter_field' => 'created_at',
'filter_days' => 30, // show only last 30 days
];
$chart1 = new LaravelChart($chart_options);
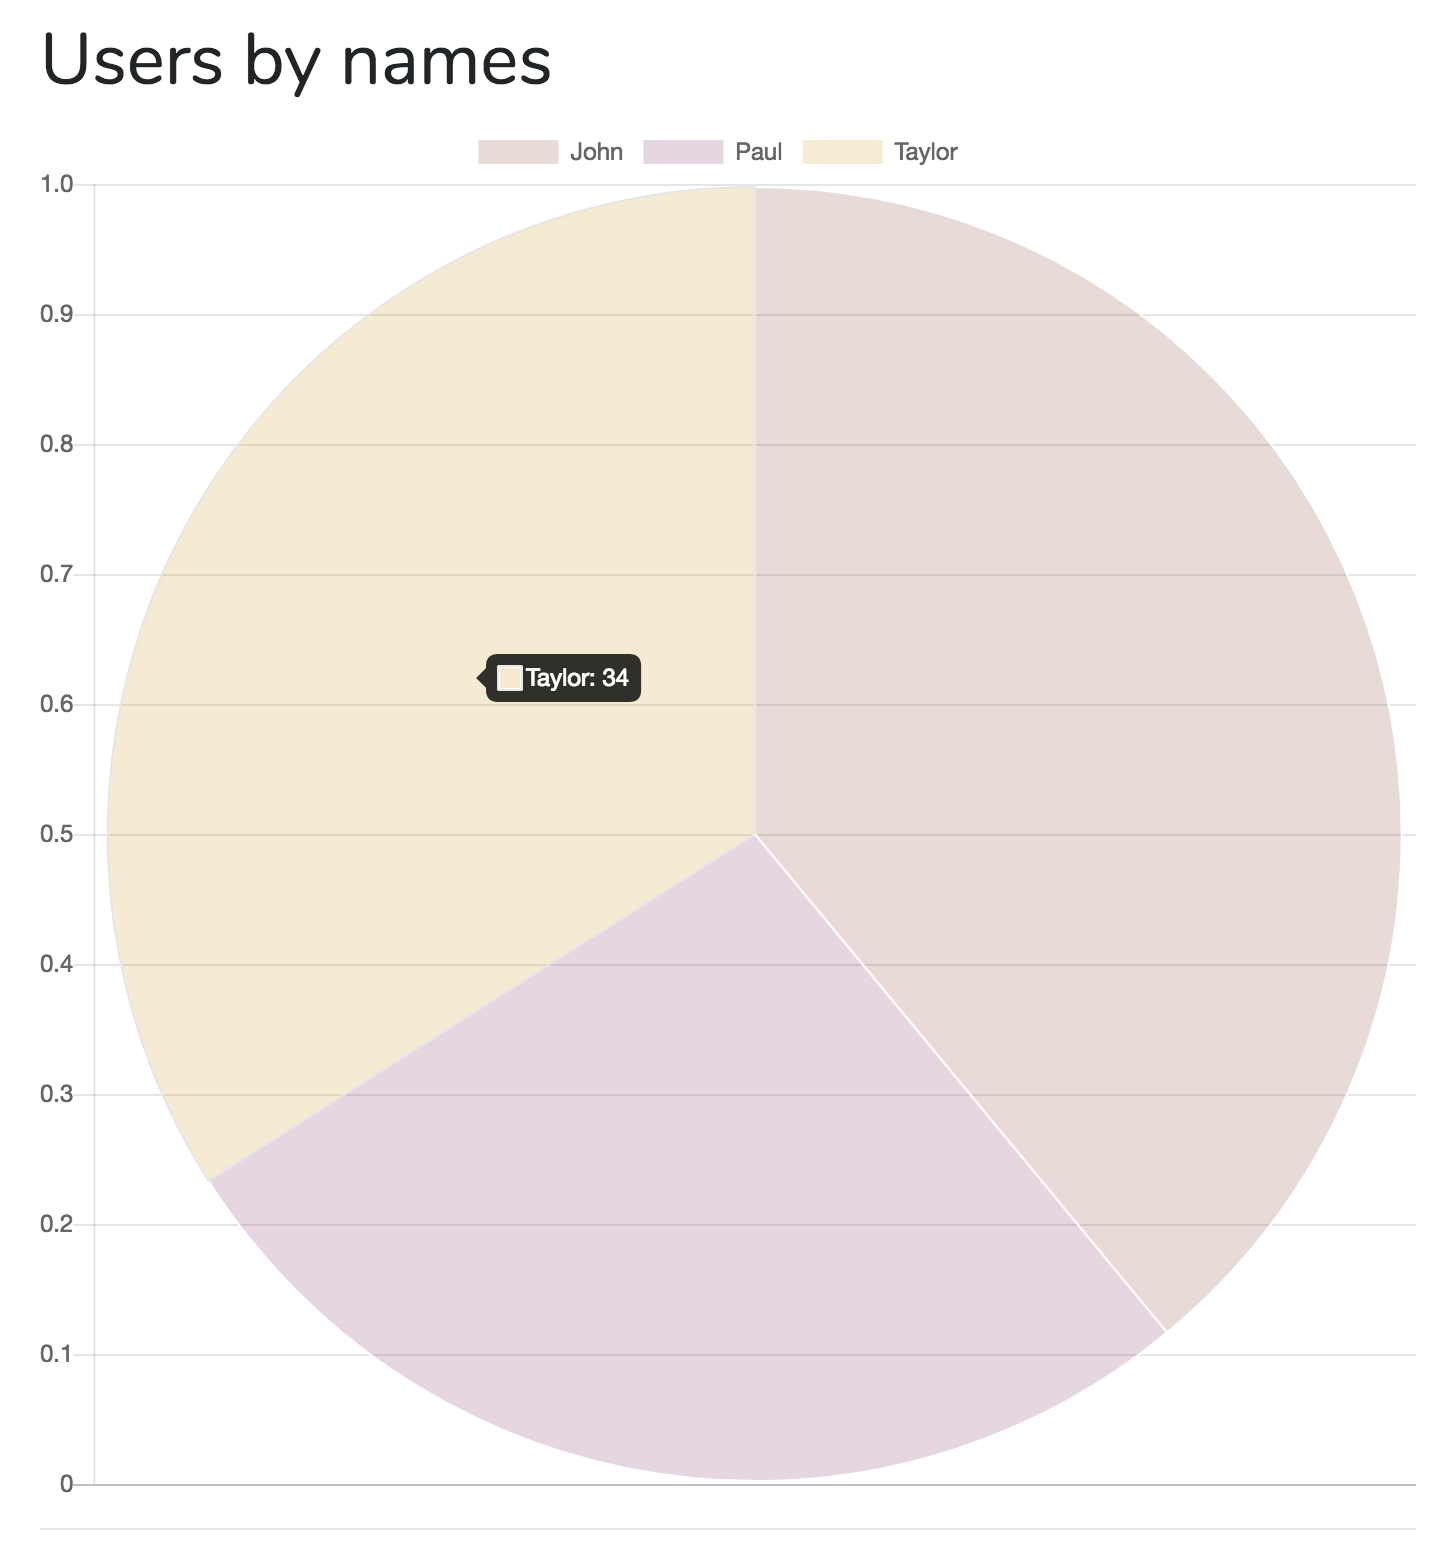
$chart_options = [
'chart_title' => 'Users by names',
'report_type' => 'group_by_string',
'model' => 'App\Models\User',
'group_by_field' => 'name',
'chart_type' => 'pie',
'filter_field' => 'created_at',
'filter_period' => 'month', // show users only registered this month
];
$chart2 = new LaravelChart($chart_options);
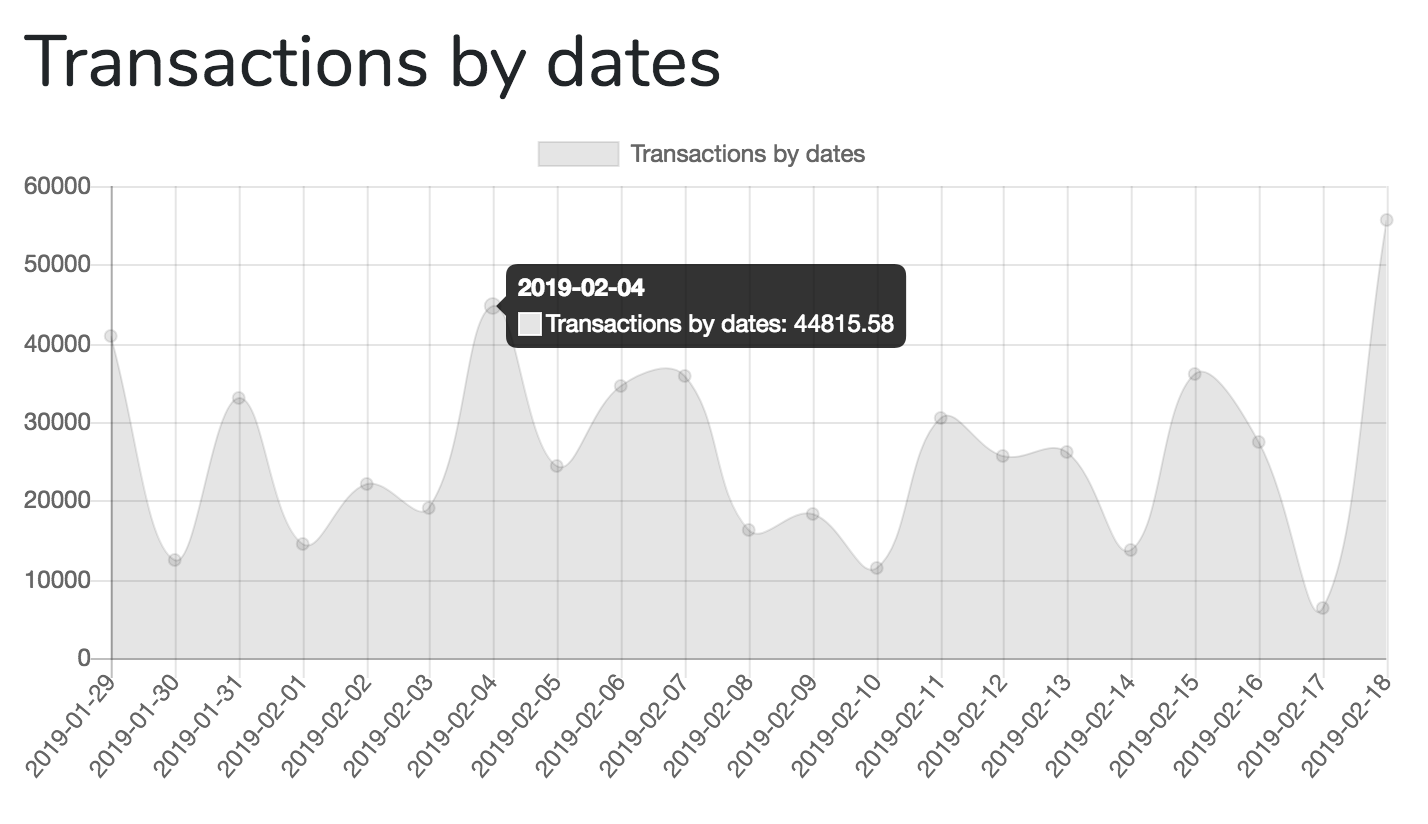
$chart_options = [
'chart_title' => 'Transactions by dates',
'report_type' => 'group_by_date',
'model' => 'App\Models\Transaction',
'group_by_field' => 'transaction_date',
'group_by_period' => 'day',
'aggregate_function' => 'sum',
'aggregate_field' => 'amount',
'chart_type' => 'line',
];
$chart3 = new LaravelChart($chart_options);
return view('home', compact('chart1', 'chart2', 'chart3'));
}
```
__View__:
```blade
@extends('layouts.app')
@section('content')
<div class="container">
<div class="row justify-content-center">
<div class="col-md-8">
<div class="card">
<div class="card-header">Dashboard</div>
<div class="card-body">
<h1>{{ $chart1->options['chart_title'] }}</h1>
{!! $chart1->renderHtml() !!}
<hr />
<h1>{{ $chart2->options['chart_title'] }}</h1>
{!! $chart2->renderHtml() !!}
<hr />
<h1>{{ $chart3->options['chart_title'] }}</h1>
{!! $chart3->renderHtml() !!}
</div>
</div>
</div>
</div>
</div>
@endsection
@section('javascript')
{!! $chart1->renderChartJsLibrary() !!}
{!! $chart1->renderJs() !!}
{!! $chart2->renderJs() !!}
{!! $chart3->renderJs() !!}
@endsection
```

---
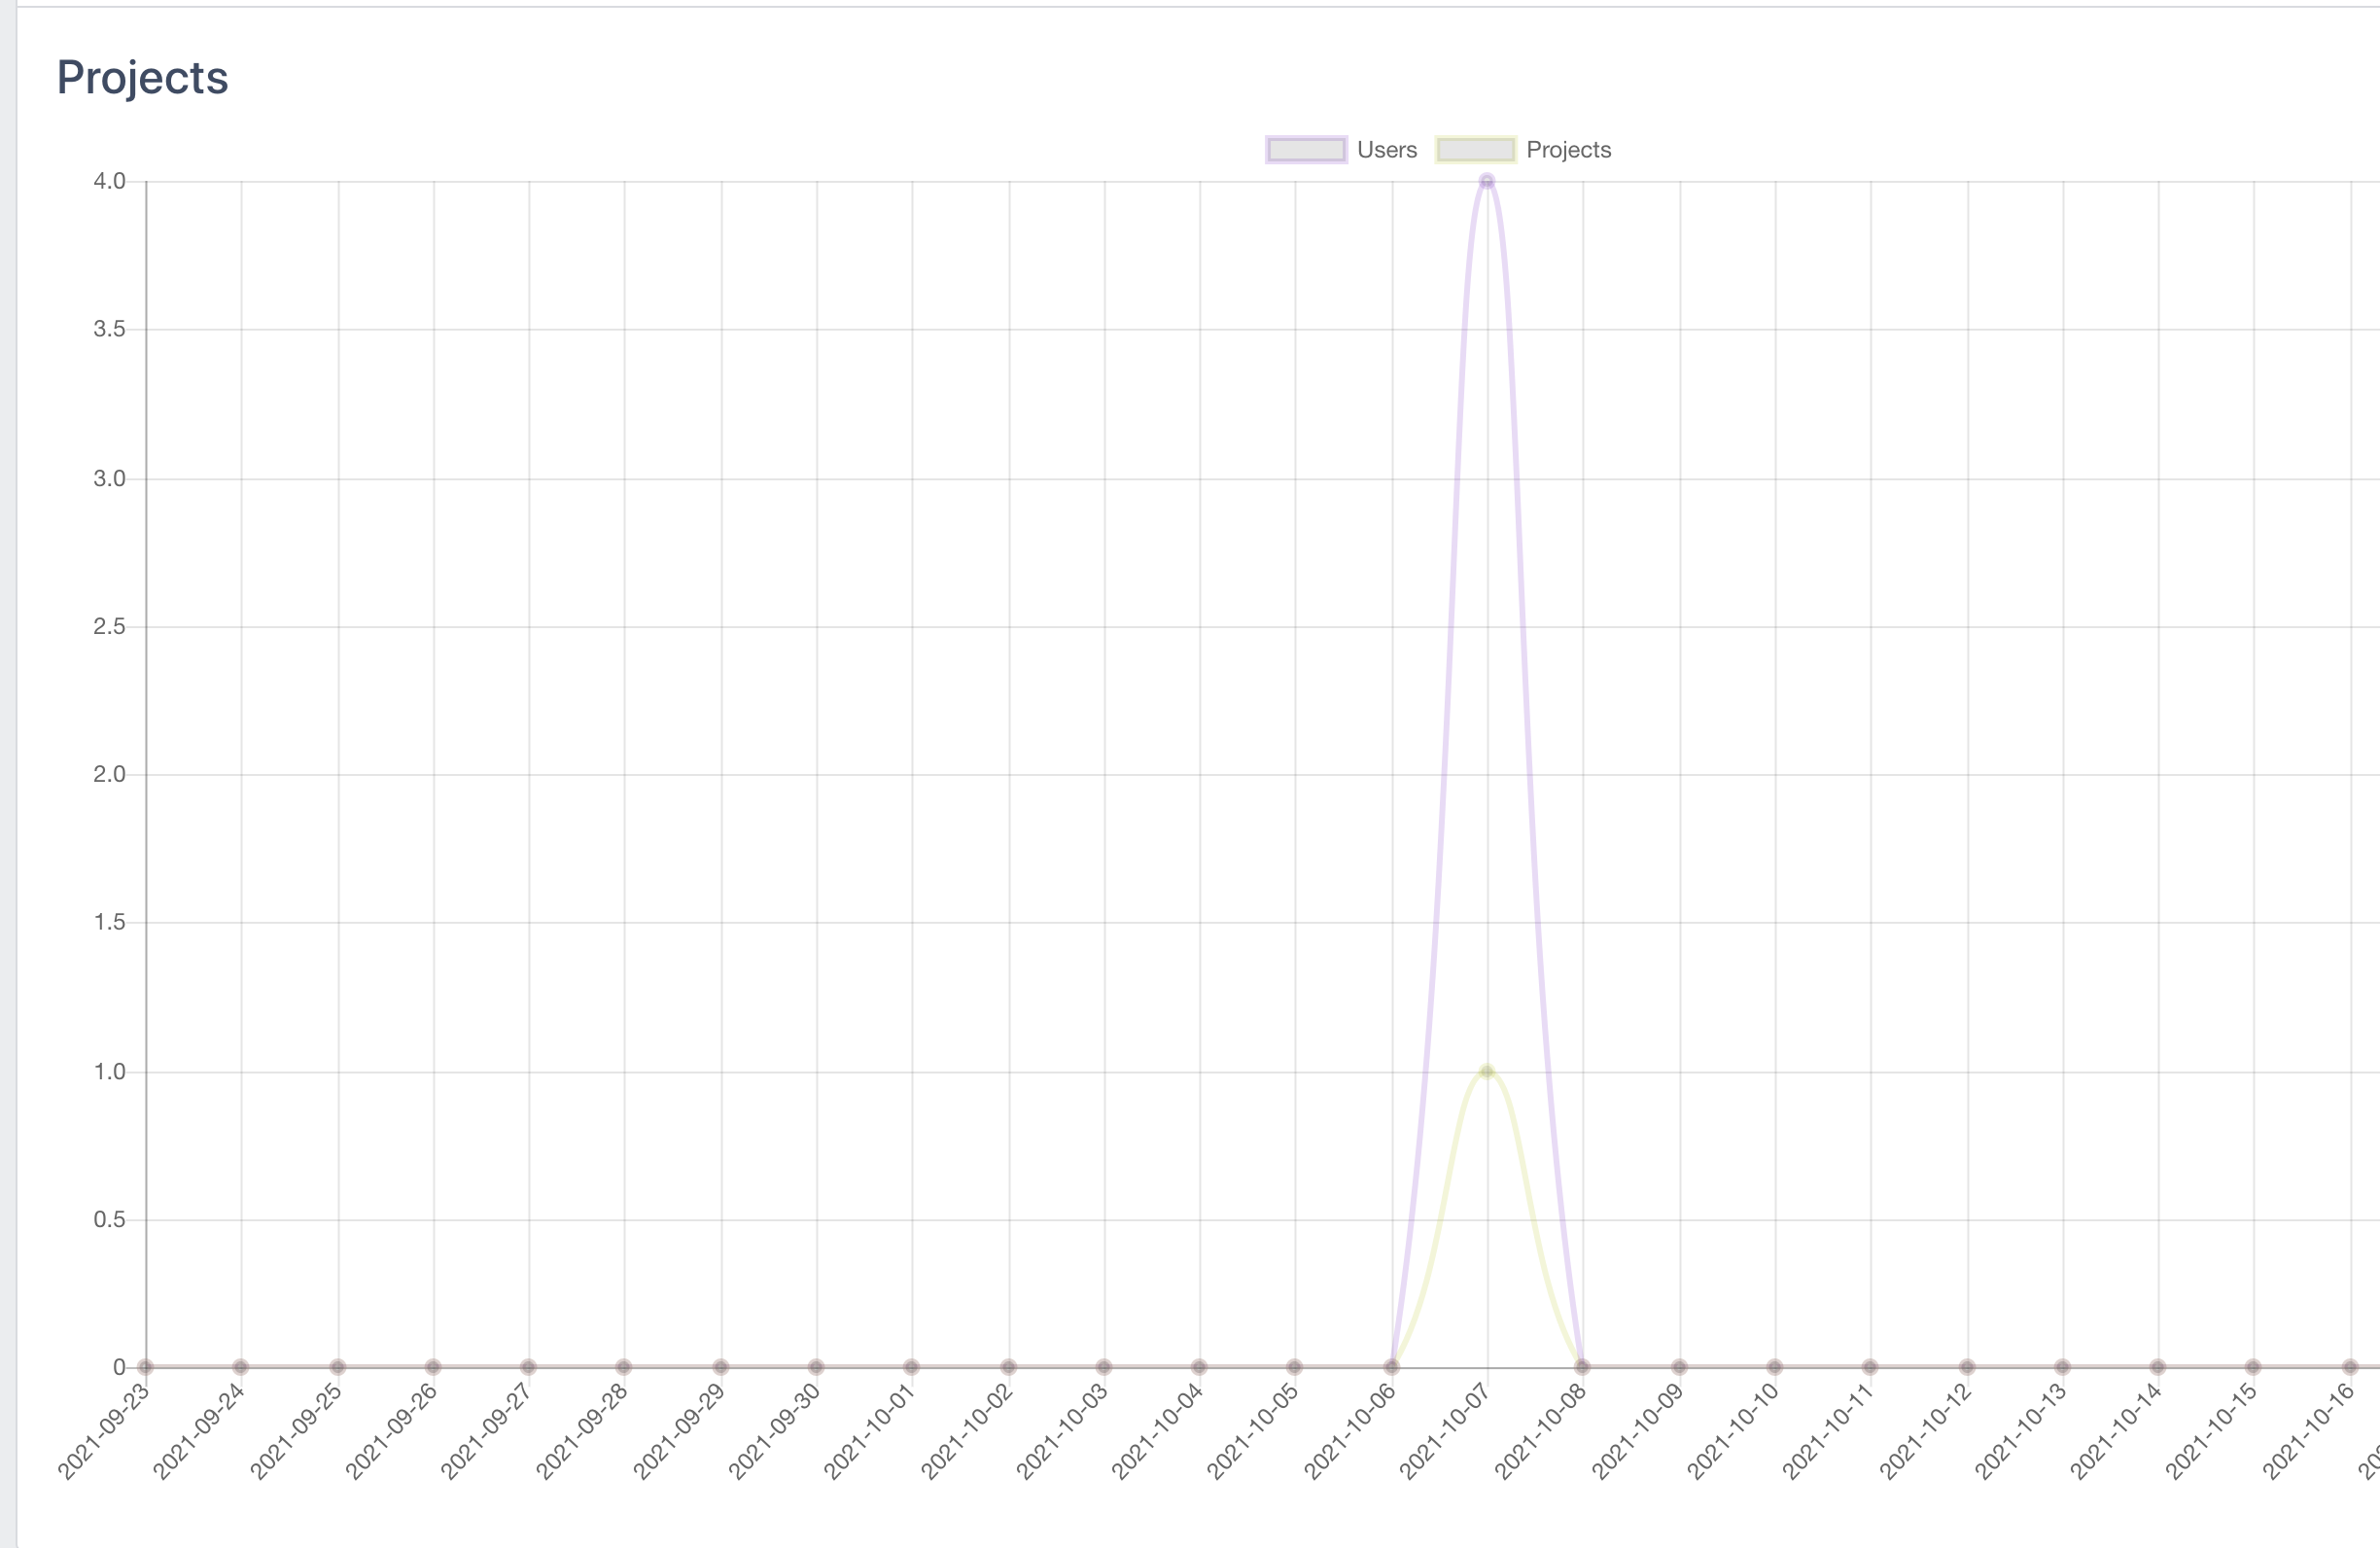
## Multiple Datasets
This is a new feature from v0.1.27. You can provide multiple arrays of settings to the `LaravelChart` constructor, and they will be drawn on the same chart.
```php
$settings1 = [
'chart_title' => 'Users',
'chart_type' => 'line',
'report_type' => 'group_by_date',
'model' => 'App\Models\User',
'group_by_field' => 'created_at',
'group_by_period' => 'day',
'aggregate_function' => 'count',
'filter_field' => 'created_at',
'filter_days' => '30',
'group_by_field_format' => 'Y-m-d H:i:s',
'column_class' => 'col-md-12',
'entries_number' => '5',
'translation_key' => 'user',
'continuous_time' => true,
];
$settings2 = [
'chart_title' => 'Projects',
'chart_type' => 'line',
'report_type' => 'group_by_date',
'model' => 'App\Models\Project',
// ... other values identical to $settings1
];
$chart1 = new LaravelChart($settings1, $settings2);
```
---
## License
The MIT License (MIT). Please see [License File](license.md) for more information.
---
## More from our LaravelDaily Team
- Check out our adminpanel generator [QuickAdminPanel](https://quickadminpanel.com)
- Read our [Blog with Laravel Tutorials](https://laraveldaily.com)
- FREE E-book: [50 Laravel Quick Tips (and counting)](https://laraveldaily.com/free-e-book-40-laravel-quick-tips-and-counting/)
- Subscribe to our [YouTube channel Laravel Business](https://www.youtube.com/channel/UCTuplgOBi6tJIlesIboymGA)
- Enroll in our [Laravel Online Courses](https://laraveldaily.teachable.com/)